
Edition 1. October 1-31, 2026 indicators, with a November 16 asking-rent snapshot. Prepared November 16, 2026. Sales data refer to September, the latest released month at publication.
Download the full report (PDF) · Download supporting data and calculation notes (ZIP)
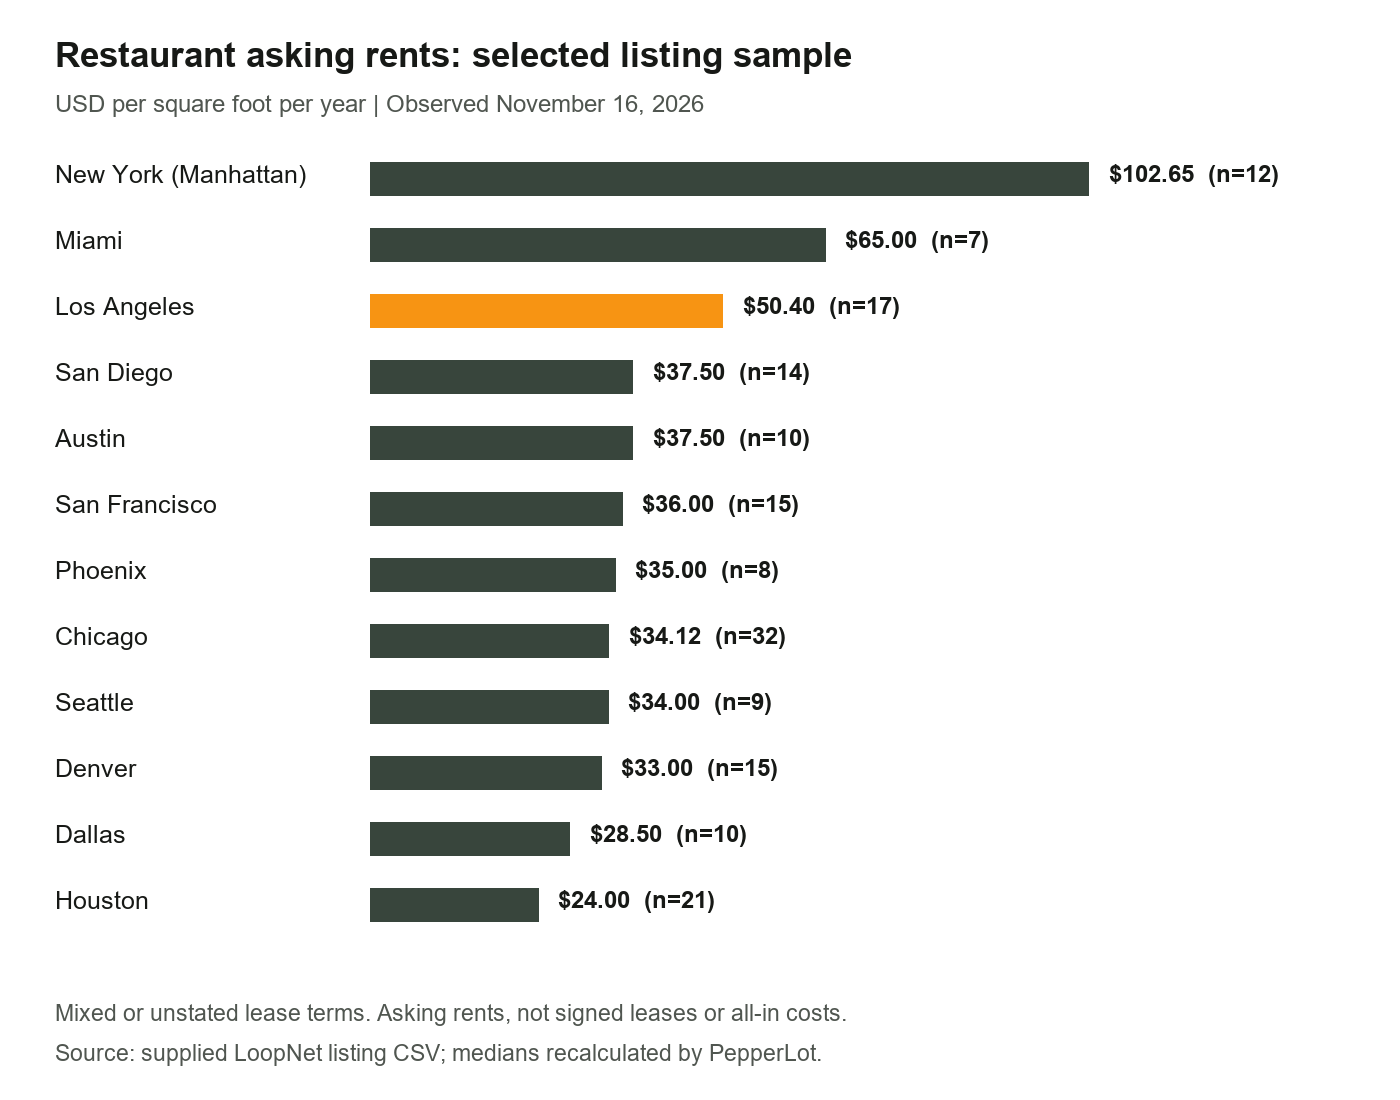
Restaurant operators face different signals across sales, staffing and site costs. National food-service sales increased in September, while October restaurant payrolls edged down and menu prices rose. In the supplied 12-city listing sample, Los Angeles had a median advertised rent of $50.40 per square foot per year, compared with $36.00 in San Francisco. These small samples describe the listings collected, not the entire rental market.
The key findings
$92.9 billion in September sales. Food services and drinking places sales were up 1.1% from August and 7.0% from September 2025. These are seasonally adjusted dollar sales, not inflation-adjusted volumes.
7,200 fewer jobs in October. Preliminary seasonally adjusted payrolls in food services and drinking places were 12.3837 million, still 57,200 above October 2025.
Menu prices increased 0.5% in October. BLS did not publish a comparable annual change because the October 2025 index was unavailable.
LA rent was 40% above San Francisco in this sample. LA had 17 priced listings and San Francisco had 15. The difference is descriptive, not a statistically established premium for comparable premises.
National restaurant indicators
-
Food-service and drinking-place sales, SA — Period: Sep 2026; Result: $92.906B; +1.1% m/m; +7.0% y/y.
-
Food-service and drinking-place payrolls, SA, preliminary — Period: Oct 2026; Result: 12.3837M; -7,200 m/m; +57,200 y/y.
-
Food away from home CPI, SA — Period: Oct 2026; Result: +0.5% m/m; annual change unavailable.
-
Full-service meals and snacks CPI, NSA — Period: Oct 2026; Result: +0.7% m/m.
-
Limited-service meals and snacks CPI, NSA — Period: Oct 2026; Result: +0.4% m/m.
Sources: Census September retail and food-services release, October 15; BLS employment release, November 6, Table B-1; BLS CPI release, November 10. SA means seasonally adjusted; NSA means not seasonally adjusted. October advance sales were scheduled for November 17 and are not included here. BLS notes that the 2025 lapse in appropriations prevented publication of October 2025 CPI indexes.
Restaurant asking rents across 12 city samples
The source file contains 205 listing records. Removing seven records explicitly labeled outside the core city boundaries leaves 198 records, of which 170 have numeric asking rents. The comparison gives each priced property equal weight. It mixes lease structures and includes listings where the expense basis is unstated.
-
New York (Manhattan) — Priced listings: 12; Median $/SF/year: $102.65.
-
Miami — Priced listings: 7; Median $/SF/year: $65.00.
-
Los Angeles — Priced listings: 17; Median $/SF/year: $50.40.
-
San Diego — Priced listings: 14; Median $/SF/year: $37.50.
-
Austin — Priced listings: 10; Median $/SF/year: $37.50.
-
San Francisco — Priced listings: 15; Median $/SF/year: $36.00.
-
Phoenix — Priced listings: 8; Median $/SF/year: $35.00.
-
Chicago — Priced listings: 32; Median $/SF/year: $34.12.
-
Seattle — Priced listings: 9; Median $/SF/year: $34.00.
-
Denver — Priced listings: 15; Median $/SF/year: $33.00.
-
Dallas — Priced listings: 10; Median $/SF/year: $28.50.
-
Houston — Priced listings: 21; Median $/SF/year: $24.00.
Manhattan and Miami have the highest medians in this collected sample; Houston has the lowest. Manhattan represents one borough, not all of New York City. Six Miami-postal records outside city limits and one Seattle-area record outside the city are excluded. These geographic labels follow the source file and were not independently geocoded.
The LA-to-San Francisco calculation is ($50.40 / $36.00 - 1) x 100 = 40%. This does not demonstrate a rent increase over time. Collection occurred November 16, so the comparison is not an October historical rent series. The available NNN-only samples are too small to support a like-for-like city ranking.
Advertised rates can exclude common-area maintenance, property taxes, insurance, key money, acquisition costs and construction. The file includes lease-assignment and pre-construction examples, so it should not be described as a sample consisting entirely of turnkey or second-generation restaurants. No completed lease or restaurant sale prices are measured.
California licensing: transfers form a large share of activity
Recalculating the supplied California ABC rows after collapsing duplicate license-number/report-date records within each series gives the counts below. The scope is license types 23, 41, 47, 48 and 75 in three counties. The category includes bars, breweries and some non-restaurant businesses, and excludes restaurants without the selected alcohol licenses.
-
Los Angeles County — Series: Applications; Total: 71; Original: 24; Person transfer: 43; Other: 4.
-
Los Angeles County — Series: Issued; Total: 67; Original: 21; Person transfer: 42; Other: 4.
-
San Francisco — Series: Applications; Total: 25; Original: 12; Person transfer: 12; Other: 1.
-
San Francisco — Series: Issued; Total: 17; Original: 8; Person transfer: 9; Other: 0.
-
San Diego County — Series: Applications; Total: 23; Original: 9; Person transfer: 12; Other: 2.
-
San Diego County — Series: Issued; Total: 35; Original: 15; Person transfer: 19; Other: 1.
Person-transfer-related actions account for 43 of 71 Los Angeles County applications (60.6%), 12 of 25 San Francisco applications (48.0%), and 12 of 23 San Diego County applications (52.2%). PER and combined codes containing PER are grouped together. ORI is original; the remaining actions are shown as other. Applications and issued licenses are separate series and should not be added as completed transactions.
Source: California ABC daily reports, as collected in the supplied CSV. The 253 raw California rows reduce to 238 unique events under this rule. Arithmetic and deduplication were checked for this edition; all original daily pages were not independently re-fetched. License applications do not establish business-sale completion, opening dates or closure dates.
Other metros: useful leads, different definitions
The source file also includes New York, Chicago, Texas, Arizona, Denver and Washington licensing records. These agencies report different events: pending applications, original issue dates, active-license snapshots or discontinuations. They cannot be combined into a national opening count or ranked as comparable market activity.
New York pending records are a lower bound and its active-license snapshot is dated November 10. Texas original issue dates can include ownership or entity changes. Phoenix requires additional record-level checking. Denver includes two salon records that should be excluded from a restaurant-focused count. Seattle covers only October 21-31 and its source reports a data-transfer issue. Miami-Dade records were unavailable to the original collector. This edition does not present these figures as verified opening or closure totals.
Restructuring watch
Restaurant Dive reported that True Food Kitchen filed for Chapter 11 on October 4 and closed 12 restaurants, with 34 continuing to operate. Nation's Restaurant News reported Out West Restaurant Group's Chapter 11 filing on November 2, after 10 closures leading up to the filing. The latter filing is a November development, included only as subsequent context. These examples are not a nationwide closure rate or proof that a specific property is available.
How buyers, tenants and sellers can use this report
Buyers and tenants: use the city samples to frame questions, then compare nearby premises with similar size, condition and lease terms. Obtain the full expense schedule and confirm equipment, permits and landlord requirements for the actual site. A low advertised base rent alone does not establish a lower total occupancy cost.
Sellers and listing agents: make the asking price, rent, lease structure, equipment inclusions and transaction type clear. Keep business acquisition prices separate from real estate rent. Provide the documents a prospect needs to assess the specific opportunity.
Browse current restaurant listings on PepperLot or list your restaurant. For local context, read our Los Angeles November 1-14 market update.
Methodology and limits
This first monthly USA edition is a baseline, not a trend index. National figures were matched to official releases. The asking-rent medians and California licensing counts were recalculated from the supplied research CSV. This checks the calculations, not every underlying listing or government record. The full listing sample was not independently re-scraped. Small non-random samples, unpriced listings, mixed lease terms and differing geographic coverage limit comparisons. No causal or statistically significant market-wide conclusion is asserted.
The full-month October licensing counts are not directly compared with a partial November window. Unconfirmed RPI and foot-traffic claims, pooled South Bay medians and unreconciled licensing totals from other states are excluded from the headline findings. PepperLot operates a restaurant marketplace. Listing references describe third-party advertised terms and are not an appraisal or availability certification.
Data provenance: pepperlot_usa_restaurant_market_2026-10.csv supplied with the report. Each rental record contains its original listing URL. The original file contains several research datasets and notes, including items not used in this article. The supporting package includes that file and the recalculation audit so the published sample can be reproduced.